 SHL Verify Interactive G+ Assessment Practice [2025]
The SHL Verify Interactive G+ test evaluates cognitive abilities and is used as part of the hiring process by many organisations.
The main challenge of the interactive version is that the questions are open-ended with endless possible answers, which requires active engagement, advanced thinking capabilities, and quick interpretation of data.
Our Verify Interactive G+ preparation pack is designed to familiarise you with the test and its unique features and help you pass the test with a high score. It includes:
- Full SHL Verify Interactive (G+) Simulations in the same structure and difficulty level as the actual assessment so that you will know what to expect on the test day.
- Focused Practice of all the different types of questions – numerical reasoning, deductive reasoning, and inductive reasoning, so that you can practice each ability on its own and strengthen it before taking the next simulation.
- Interactive Study Guides & Video Tutorials with strategies, tips, and hacks to improve your score by quickly identifying the information you need to solve each question.
JobTestPrep is a leading test prep company that offers accurate and constantly updated SHL practice simulations and study guides, offering the only preparation for the SHL Verify Interactive (G+) on the market.
- 3 Full SHL Verify Interactive (G+) Simulations
- Focused Practice:
- 2 Numerical Reasoning Test
- 2 Deductive Reasoning Tests
- 2 Inductive Reasoning Tests
- Study Guides & Tutorials
- Verify G+ Non-Interactive Extra Practice
What Is the SHL Verify Interactive?
The SHL Verify Interactive G+ is the interactive version of the SHL General Ability Test (G+).
As opposed to the non-interactive version, in which you are presented with a multiple-choice question and required to choose the correct one, on the Interactive Verify G+ test you will be actively engaging with the test by typing your answers, connecting nodes, dragging and dropping, and so on.
It contains 24 questions to be solved in 36 minutes.
Questions in the SHL Verify Interactive Test are evenly distributed between 3 categories (8 questions each):
- Numerical - An assessment of your ability to understand, analyze, and draw logical conclusions from quantitative data presented in the form of numbers, charts, graphs, or tables. The main focus of these questions is dealing with interactive, complex tables and graphs.
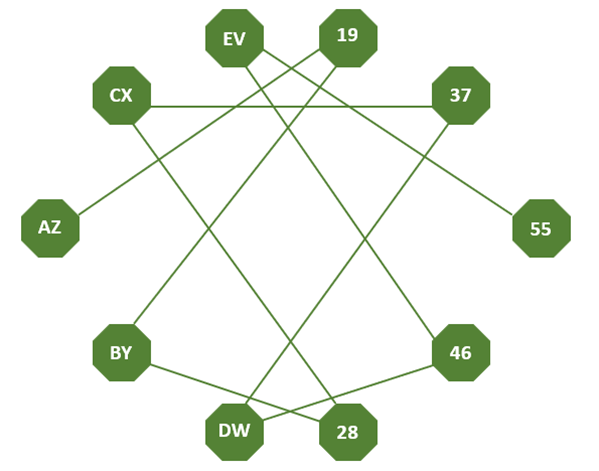
- Inductive - An assessment of your ability to recognize patterns, make generalizations, and draw conclusions based on specific evidence or observations. On these kinds of questions, you will need to interact and experiment with rules applied to abstract shapes.
- Deductive - An assessment of your ability to use general rules or principles to make specific conclusions or predictions. Interactive deductive questions will require you to rank or organise schedules and calendars by dragging and dropping.
It is no coincidence that 1.5 minutes are given per question (an eternity in the world of psychometric testing), as the questions on the SHL Verify Interactive Assessment are sophisticated, elaborate, and complex.
SHL Verify Interactive Sample Questions and Answers
Here is one sample question for each category of the SHL Verify G+ Interactive Test:
SHL Verify Interactive G+ Sample Question - Numerical
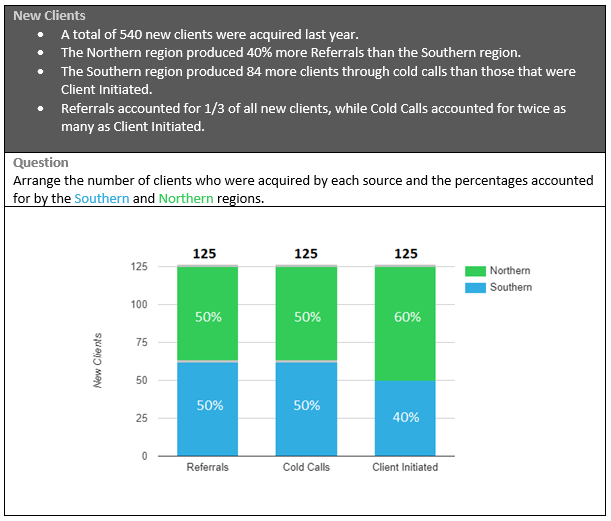
The SHL Interactive Verify G+ is loaded with tricks and pitfalls which you will not be aware of until the actual test:
- What's the meaning of the grey lines on bar graphs?
- How can 4-variable pie chart questions be solved with only 3 equations?
- How will SHL try to distract you with vague question phrasing?
Ace the Interactive Version
The SHL Verify Interactive G+ Practice is the ONLY online prep course for the interactive version of the SHL verify G+ test with practice questions that follow the content, structure, and format of the actual SHL Interactive Test.
SHL Verify Interactive G+ Sample Question - Inductive
Complete the sequence:
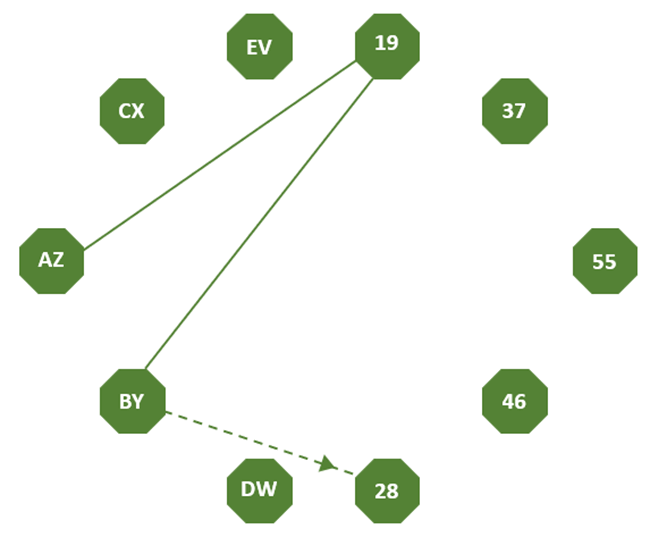
Inductive questions on the SHL Verify Interactive G+ Assessment are unique to the test and you will encounter them nowhere else.
Prepare with Accurate Practice Materials
Simulating the complex interactive formatting of these questions is crucial. The SHL Verify Interactive G+ Practice is the only online prep to help you achieve this.
SHL Verify Interactive G+ Sample Question - Deductive
Place each worker in the correct room at 2:30 p.m.
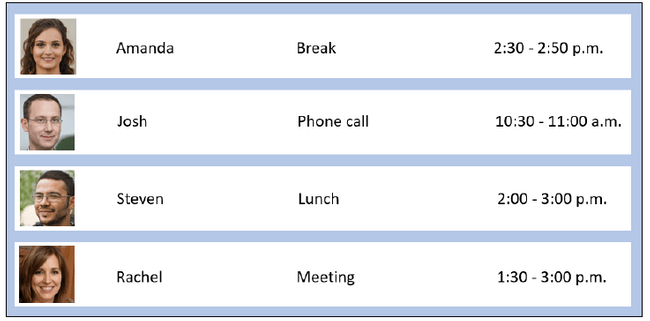
- When there isn’t a scheduled activity, workers are at their desks.
- Phone calls are made in the conference room.
- Lunch is eaten in the dining area, and breaks are taken on the balcony.
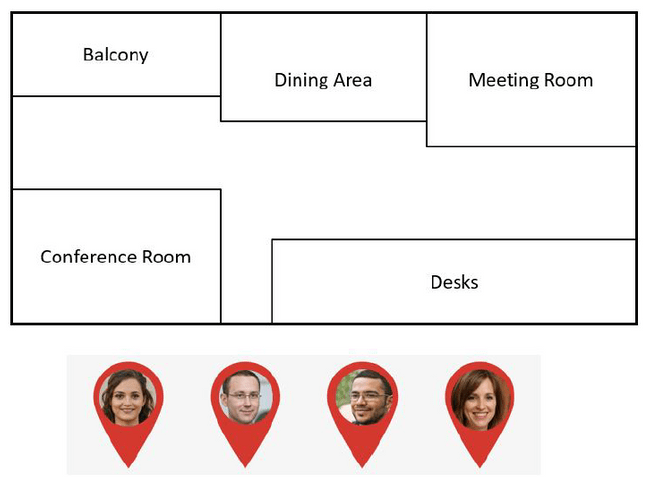
Being well-practiced with SHL Verify Interactive Test deduction questions will allow you more time for the more complex numerical and deductive questions.
The Most Trusted SHL Verify Interactive Prep Online
The SHL Verify Interactive G+ Practice contains practice questions specifically tailored to get you familiar with the fastest and most accurate ways to solve the exact types of questions on the actual test!
The SHL Verify Interactive G+ Practice is currently the only online preparation with mock tests of the SHL Interactive Test, which follow the actual test's unique format, question style, and the world of content.
💡 Check out our free SHL Practice Test.


